Latest Financial Results Investors
FY26.3 Q4
Full-Year Results
Both net sales and operating profit reached record highs
Full-year net sales for FY2026.3 (April to March) reached a record high of 137,516 million yen, up 3.9% YoY.
On the profit front, gross profit grew to 73,065 million yen (up 6.0% YoY), lifting the gross profit margin to 53.1%, up 1.0 percentage point YoY. In addition, with the absence of one-time expenses such as those related to J-ESOP recorded in the previous year, operating profit came in at 25,980 million yen (up 18.6% YoY) and the operating profit margin was 18.9%, up 2.3 percentage points YoY.
Ordinary profit grew to 34,025 million yen (up 10.4% YoY), even as share of profit from equity-method affiliate YOUNGONE OUTDOOR Corporation (South Korea) declined. However, net income declined to 24,264 million yen (down 0.8% YoY) due to the recording of an extraordinary loss on the sale of shares.
In FY26.3, despite adverse factors, including a decline in inbound demand from mainland China, we maintained high levels of growth and profitability.
| Net sales | Gross Profit | Operating Profit | Ordinary Profit | Ordinary Profit | |
|---|---|---|---|---|---|
| Results (Full Year) | 137,516 | 72,946 | 25,859 | 33,904 | 24,094 |
| YoY | 103.9% | 105.8% | 118.0% | 110.1% | 98.6% |
| YoY(Quarterly) | 107.3% | 106.5% | 143.8% | 137.7% | 131.0% |
| Operating profit margin | ― | 53.0% | 18.8% | 24.7% | 17.5% |
| Results for the previous period | ― | 52.1% | 16.6% | 23.3% | 18.5% |
| Q1 | Q2 | Q3 | Q4 | Full year | ||
|---|---|---|---|---|---|---|
| Net sales | Results | 23,878 | 31,711 | 43,882 | 38,044 | 137,516 |
| YoY | 97.1% | 110.2% | 101.0% | 107.3% | 103.9% | |
| Operating Profit | Results | 2,079 | 4,880 | 11,758 | 7,142 | 25,859 |
| YoY | 113.1% | 144.6% | 100.3% | 143.8% | 118.1% | |
| Ordinary Profit | Results | 3,189 | 3,609 | 8,453 | 8,842 | 24,094 |
| YoY | 87.1% | 85.8% | 86.0% | 131.0% | 98.6% |
Sales Trends by Business Segment
In Q4 (January to March), all business segments performed well. First, despite discontinuation of brands and slower inbound demand from mainland China from December onwards, the Performance segment rebounded in Q4 and posted net sales growth on a full-year basis.
Next, in the Lifestyle segment, strong performance of spring collection items drove net sales above the previous year’s level. The Fashion segment also remained strong, supported by the consistently solid performance of THE NORTH FACE Purple Label, and posted 18.3% YoY growth.
| Business segment | Q1-Q3 net sales |
Q1-Q3 YoY |
Q4 net sales |
Q4 YoY |
Full-year net sales |
Full-year YoY |
Full-year share |
Trend change in Q4 |
|---|---|---|---|---|---|---|---|---|
| Performance | 28,910 | 99.3% | 11,742 | 107.5% | 40,652 | 101.5% | 29.6% | Recovery |
| Lifestyle | 60,332 | 100.7% | 21,946 | 106.4% | 82,279 | 102.1% | 59.8% | Stable |
| Fashion | 9,014 | 118.3% | 4,052 | 104.0% | 13,066 | 113.4% | 9.5% | Stable |
| Other | 1,215 | 758.8% | 303 | 1131.3% | 1,518 | 812.2% | 1.1% | Growth |
| Company total | 99,472 | 102.7% | 38,044 | 107.3% | 137,516 | 103.9% | 100.0% | Stable |
Monthly Sales Trends
The left side shows monthly net sales for H1, while the right side shows monthly net sales for H2 and the full year. In Q4 (January to March), monthly net sales reached 94% of plan and 104% YoY.
Although headwinds from weaker inbound demand from mainland China and sluggish sales of some winter collection items persisted, March saw a recovery on the back of the spring collection launch and some advance deliveries to wholesale channels.
The full-year result landed at 97% of plan and 102% YoY. Please note that as the monthly trends reflect “monthly net sales,” the figures do not match the amounts or ratios of consolidated net sales.
| Month | Plan ratio | YoY | |
|---|---|---|---|
| Q1 | Apr. | 107% | 96% |
| May | 93% | 95% | |
| Jun. | 102% | 101% | |
| Q1 total | 101% | 97% | |
| Q2 | Jul. | 101% | 112% |
| Aug. | 101% | 109% | |
| Sep. | 101% | 105% | |
| Q2 total | 101% | 108% | |
| H1 total | 101% | 103% | |
| Month | Plan ratio | YoY | |
|---|---|---|---|
| Q3 | Oct. | 101% | 102% |
| Nov. | 100% | 104% | |
| Dec. | 87% | 93% | |
| Q3 total | 96% | 99% | |
| Q4 | Jan. | 92% | 101% |
| Feb. | 86% | 95% | |
| Mar. | 107% | 118% | |
| Q4 total | 94% | 104% | |
| H2 total | 95% | 102% | |
| Full-year total | 97% | 102% | |
Inbound Sales at Self-Operated Stores
Inbound ratio reached 26.5%, up 1.1 percentage points YoY; the decline in demand from mainland China was offset by H1 growth and inbound demand from other countries
In Q4 (January to March), the inbound sales ratio at self-operated stores declined by 2.9 percentage points YoY, reflecting weaker inbound demand from mainland China.
The full-year inbound sales ratio came in at 26.5%, up 1.1 percentage points YoY, driven by H1 growth and stronger inbound demand from countries other than mainland China.
While mainland China’s share of inbound net sales declined from the previous year’s 57.4% to 49.6%, inbound demand from other countries—particularly Asian countries like Taiwan, South Korea, and Thailand—continued to post double-digit growth.
| FY25.3 | FY26.3 | YoY | Mainland China share | Outside China share | |
|---|---|---|---|---|---|
| Q1 | 24.5% | 28.1% | 3.5pt | 56.6% | 43.4% |
| Q2 | 23.3% | 26.3% | 3.0pt | 60.9% | 39.1% |
| Q3 | 20.7% | 22.4% | 1.7pt | 47.2% | 52.8% |
| Q4 | 34.3% | 31.4% | (2.9)pt | 40.2% | 59.8% |
| Full year | 25.5% | 26.5% | 1.1pt | 49.6% | 50.4% |
| Monthly | FY25.3 | FY26.3 | YoY | |
|---|---|---|---|---|
| Q1 | Apr. | 25.5% | 30.9% | 5.3pt |
| May | 24.2% | 27.4% | 3.2pt | |
| Jun. | 23.9% | 25.6% | 1.7pt | |
| Q2 | Jul. | 24.8% | 24.3% | (0.5)pt |
| Aug. | 23.2% | 28.3% | 5.1pt | |
| Sep. | 22.0% | 26.3% | 4.3pt | |
| Q3 | Oct. | 24.6% | 27.9% | 3.3pt |
| Nov. | 17.8% | 18.9% | 1.1pt | |
| Dec. | 20.9% | 22.2% | 1.3pt | |
| Q4 | Jan. | 31.6% | 27.0% | (4.6)pt |
| Feb. | 41.6% | 40.7% | (0.9)pt | |
| Mar. | 30.7% | 28.3% | (2.3)pt |
THE NORTH FACE News
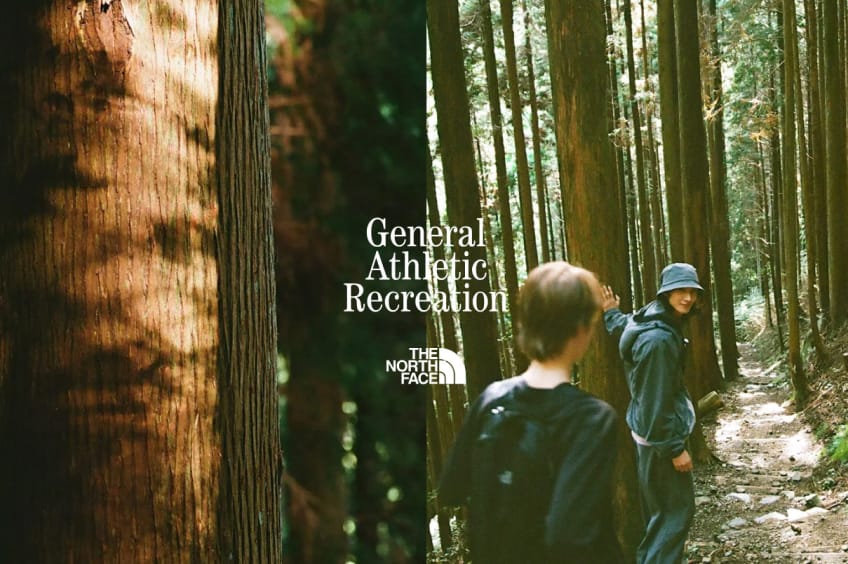
Poised to tap into new opportunities in the athletic market and further strengthen footwear
In February 2026, the brand launched a new collection, “General Athletic Recreation (GAR).” By proposing a new athletic lifestyle, born from the functionality and lightness of athletic trail running apparel, we will strengthen our approach targeting younger consumers and women in particular.
In addition, our five-year medium-term management plan identifies enhanced footwear development and the creation of new markets as areas of growth potential, and commits to investing in the development of trail running shoes and to building a lifestyle market that integrates apparel and gear with footwear.
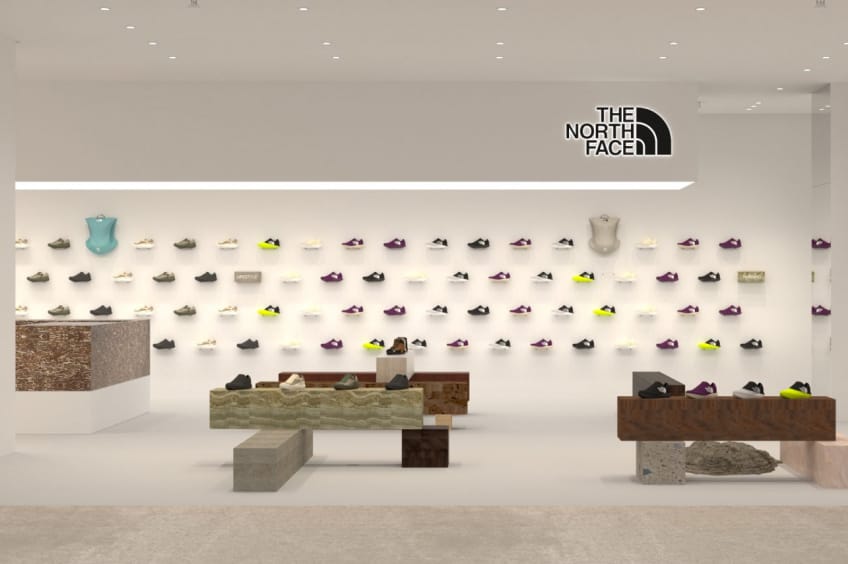
To further reinforce the footwear category, we opened the world’s first THE NORTH FACE footwear-focused concept store in Shinsaibashi, Osaka in April 2026. Visitors can experience interactive services, including 3D foot scanning and measurement, and our in-store certified shoe fitters provide personalized footwear recommendations tailored to customers’ lifestyles.
Through initiatives such as launching new collections and opening concept shops, we will create diverse touchpoints with customers and deliver new THE NORTH FACE brand experiences.
Goldwin News
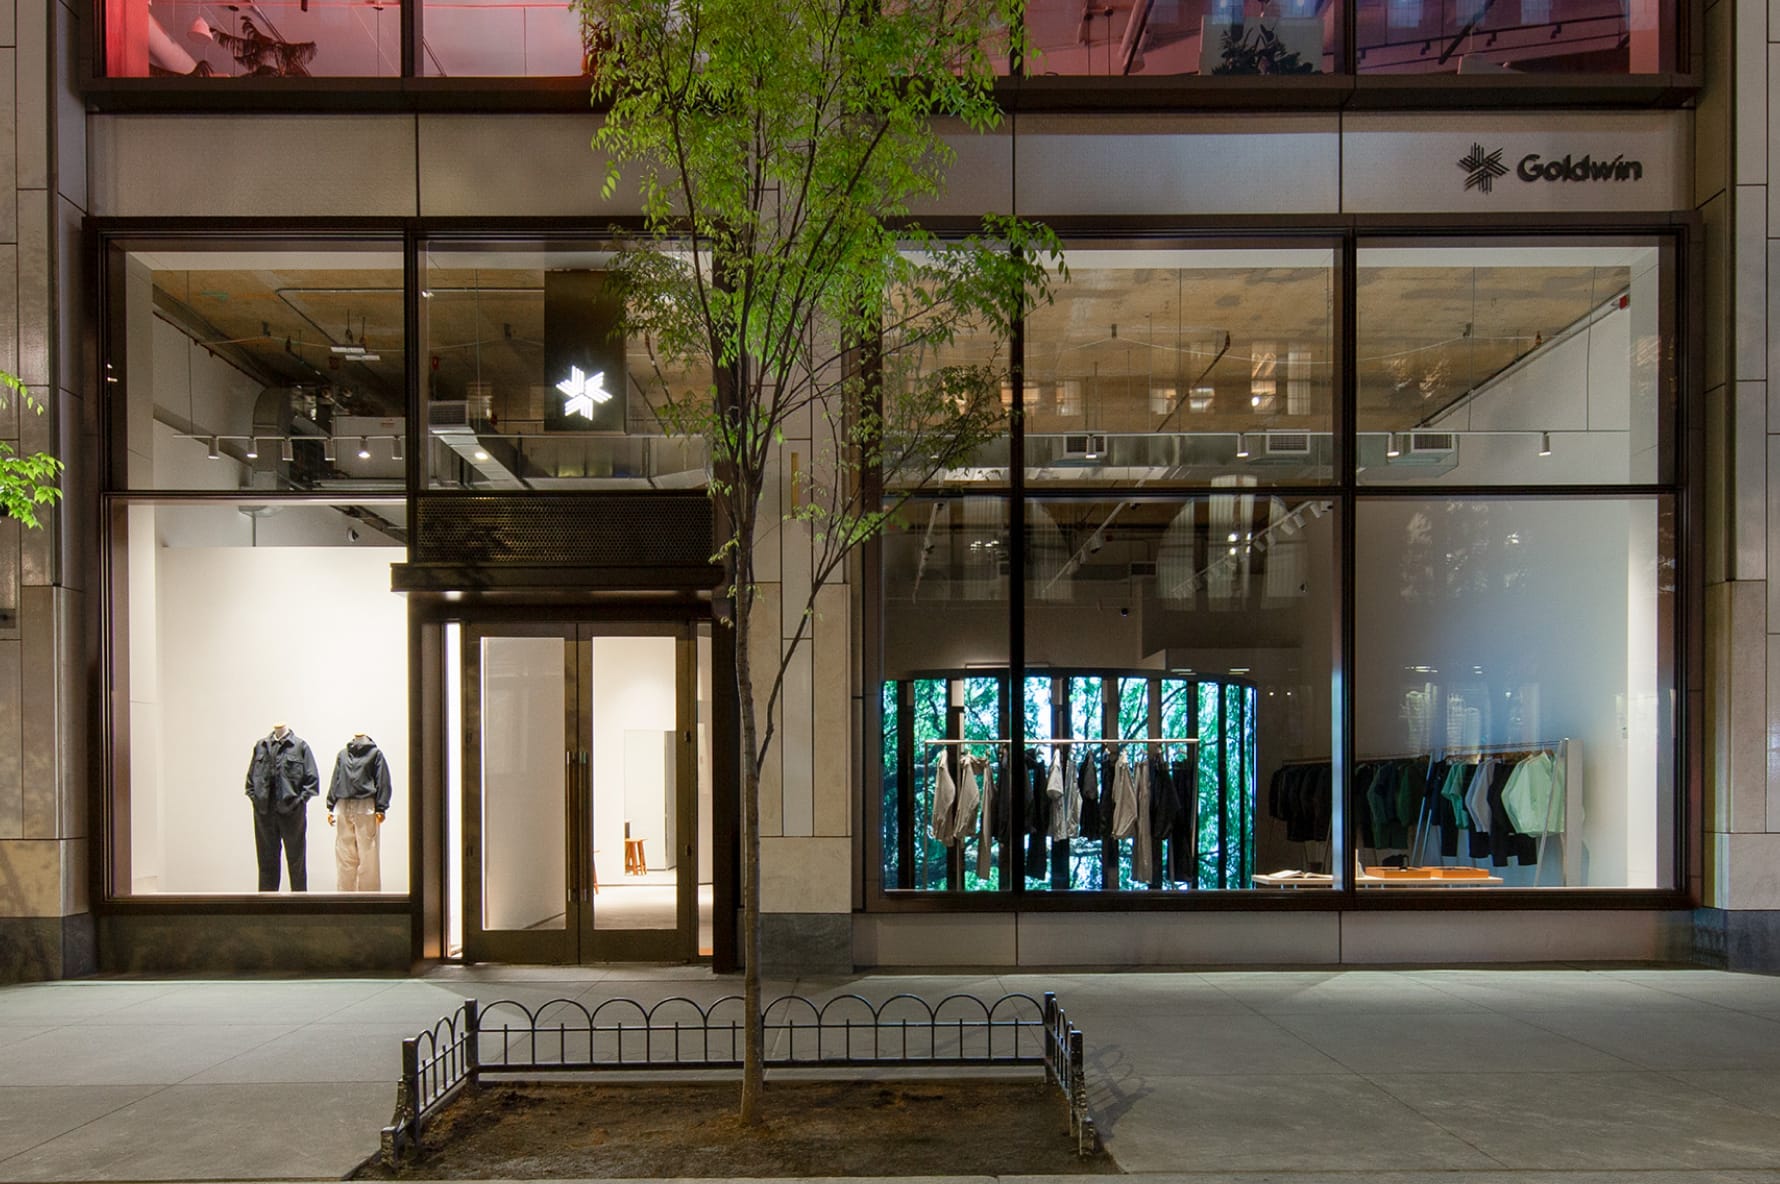
Store openings in Europe and the US are progressing as planned, as we work to raise brand awareness and expand our business foundation globally
Following the openings in London and Seoul, we opened Goldwin New York, our US flagship store, in April 2026.
The New York store is located on Lafayette Street, which sits on the border of SoHo and Nolita in Manhattan, an iconic neighborhood where diverse cultures—sports, outdoor, street, and luxury—intersect, transmitting new values and styles to the world.
By opening a street-level store that serves as our brand hub in this high-traffic location, we aim to attract fashion-forward customers.
Going forward, we will continue to accelerate store openings outside Japan and mainland China as we work to raise global brand awareness and strengthen our business foundation.